What is Google Analytics 4?
Google Analytics 4 (referred to as “GA4” from here) has become the new default property when creating a new website property in Google Analytics. For now the new version will not be a 100% replacement of Universal Analytics (referred to as “UA” from here) yet, as it’s still in beta.
GA4 is an upgrade to the formerly known “App + Web”-version of Google Analytics, and can be used for a website, an app or both. It’s made with the new privacy protection laws in mind, which has made the future for traditional cookie-based analytics uncertain. But we’ll get back to that later.
What’s new?
Built with a bigger focus on machine learning.
The built-in machine learning uses “modeling” from existing data to make assumptions about user behaviour. Such as different audiences that will be more likely to purchase certain products, highlighting this information to marketers.
E-commerce businesses will benefit from new AI-powered insights and predictions coming with GA4. This has been around for a while, but new insights and predictions can automatically alert marketers to data trends such as surging demand for products. The AI-powered insights will be able to predict outcomes such as revenue from a particular segment of customers. This is particularly valuable to marketers who can use this data to anticipate actions their customers might take and focus on specific audiences for campaigns.
Google Analytics is adapting to a cookie-less future
Google describes the purpose of this new version as the “next generation to privacy-first tracking”. It will help marketers comply with GDPR and CCPA regulations. Since third-party cookies are phased out and blocked by browsers such as Firefox and we’re moving into a cookie-less future - Google’s machine learning aims to fill in the gaps for website traffic and user behaviour where users opt out. The main goal is to shift away the focus on associating users with hits, and instead focus on events without necessarily having a user associated with it.
The customer journey in focus
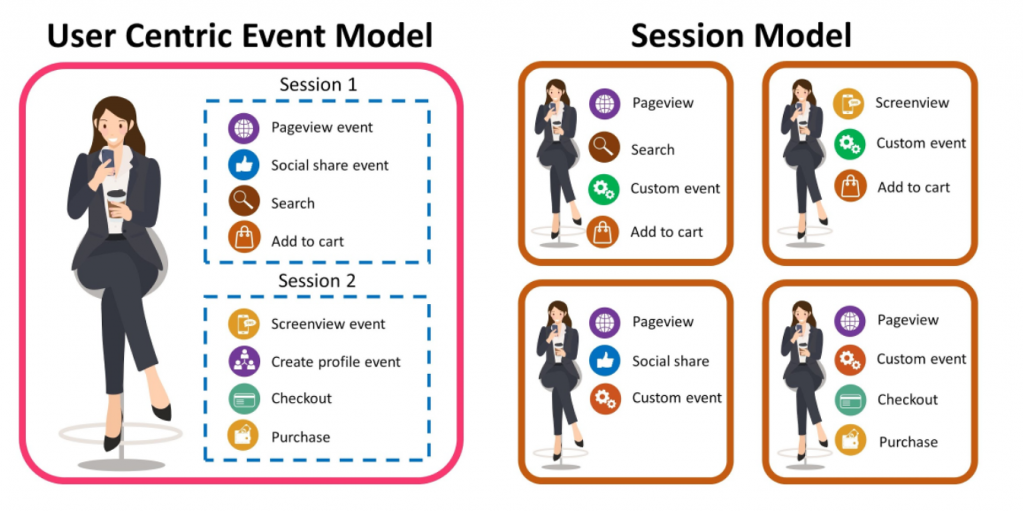
One of the biggest changes is Google Analytics’ focus on the customer journey. Google Analytics now has a new report called life cycle report, that is focused on user journey across devices. Instead of focusing on individual metrics for different pages, devices etc. GA4 focuses more on the entire journey by providing more insight to how customers are interacting from start to finish. The key to how GA4 does this is it’s user centric event model. UA uses a session-based data model where data is grouped on one user’s interaction within a single session. In GA4, event data is processed on a user centric event model, where events are tracked over multiple sessions, even on multiple devices.
To understand how GA4 is tracking the customer journey across multiple sessions and devices, we have to take a look at two features; Google Signals and User ID.
- Google Signals
Google Signals is a feature introduced in 2018 and is used for cross-device reporting and remarketing. Google Signals tracks users that are signed in on their Google-account and have turned on ads personalization. - User ID
User ID lets you attach a persistent ID to an individual user, that can track data from more than one session and across devices. The user ID is a unique value that is non-personally identifiable. To implement User-ID you must generate your own unique IDs and assign them to users, for example to customers that have logged in to your website.
To leverage this user identity-feature, make sure you have Google signals and User ID activated in GA4.
Improved audience building & remarketing
With GA4 you can create audiences by grouping together users based on any combination of dimension, metrics and events. Examples can be a custom audience of users that visited the website with an iPhone or Android device, or a custom audience of people who visited the website from a specific Instagram-campaign, or a custom audience of users who have made a purchase.
Every time GA4 receives data about these users, they are evaluated to see if they still meet the audience criteria, if they don’t- they are removed from the audience. In this way GA4 makes sure that the audience stays relevant continuously, not just because a user met the criteria once. You can also remove users from specific audiences.
Audiences are useful to better analyze why specific groups of customers aren’t engaging or why some groups of customers spend or purchase less or more.
Another thing that’s cool about the audience-feature is that it integrates well with Google Ads. Audiences in GA4 are available in a shared library in Google Ads. These audiences can be used for remarketing or to create similar audiences to prospect new users. Remarketing lets you re-engage users based on their behaviour on your website or app.
Events
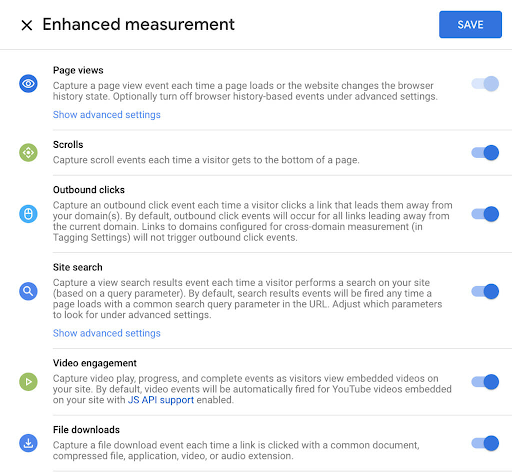
Users will be able to add and edit basic event tracking in GA without having to edit on-site code or set up tracking in tag manager. This includes interactions like page views, page scrolls, video tracking, file download etc.
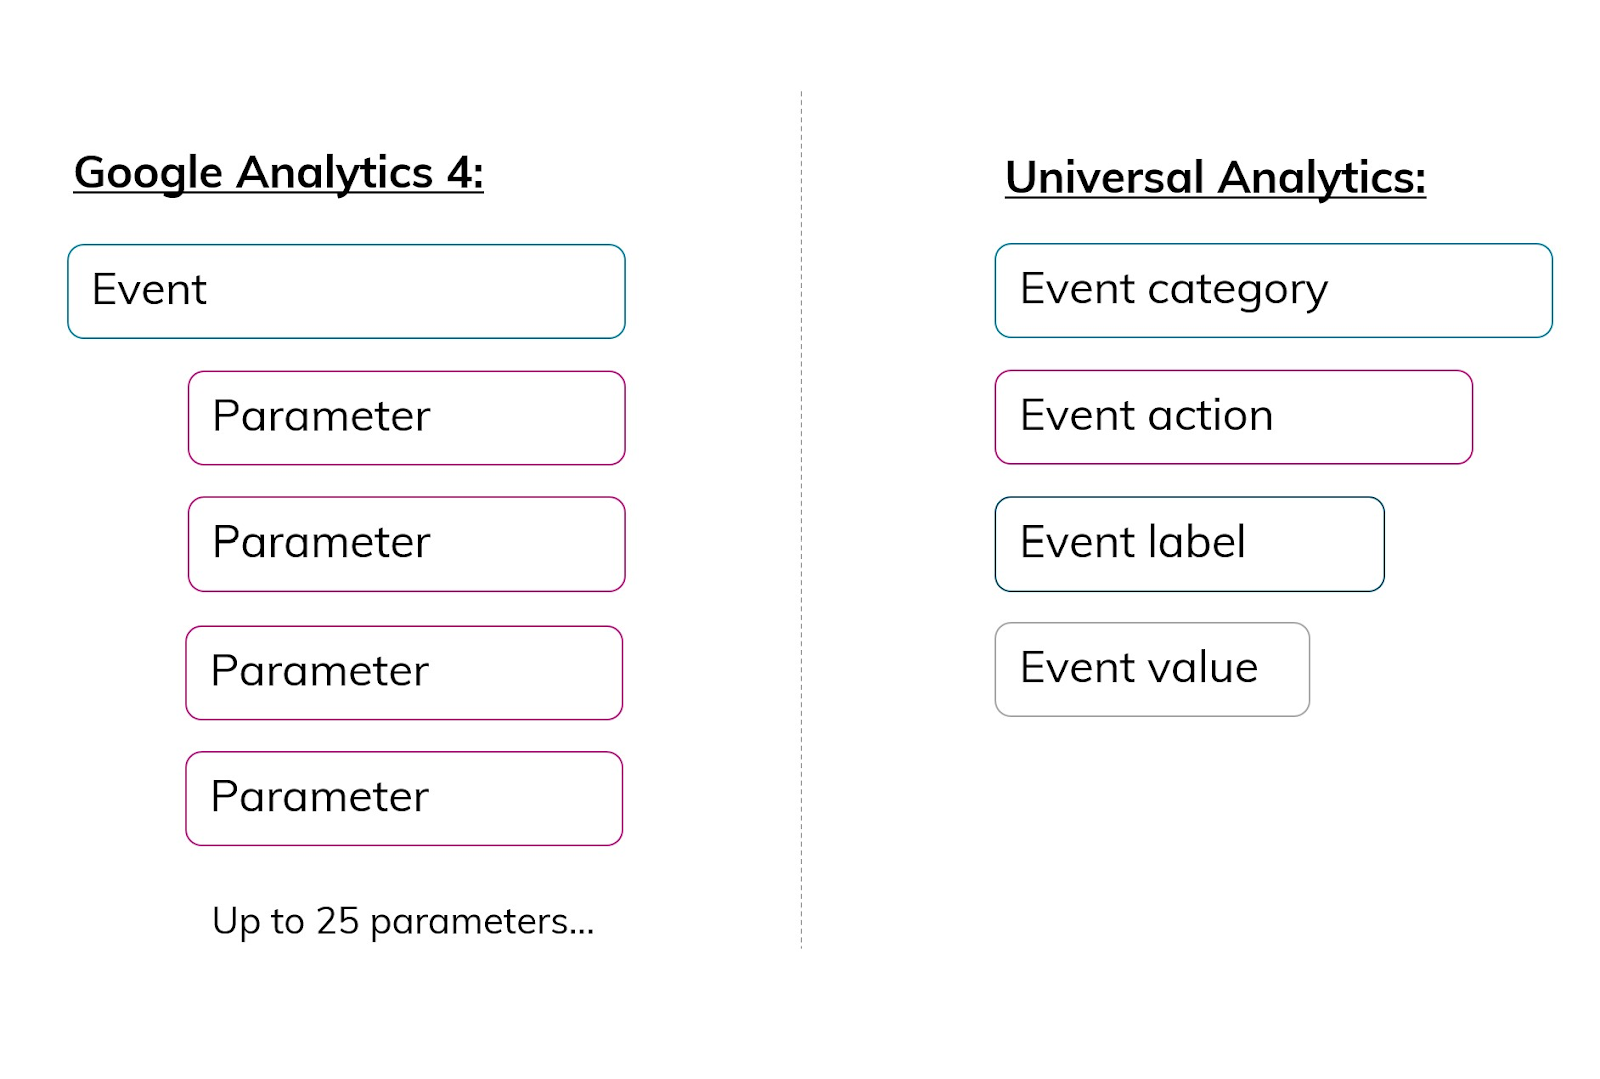
There is no longer a difference between events. In UA, events had a category, action and label associated. In GA4, every hit is an event with no distinction between hit types, they are treated equally, and use parameters instead.
This means that the data is more flexible, since you can use the data without having to have all events in the same scope. Since the group of dimensions and metrics always require the same scope in UA, it has constantly restricted the flexibility and possibilities with the data, and made UA more focused on KPIs rather than deep analysis which GA4 now opens up for.
Event parameters
In GA4 you use parameters to add additional information about events. You can add up to 25 parameters for every event, and you can name them what you want.
For example, if you set up tracking for pdf-downloads, you could structure the parameters like this to get additional information.
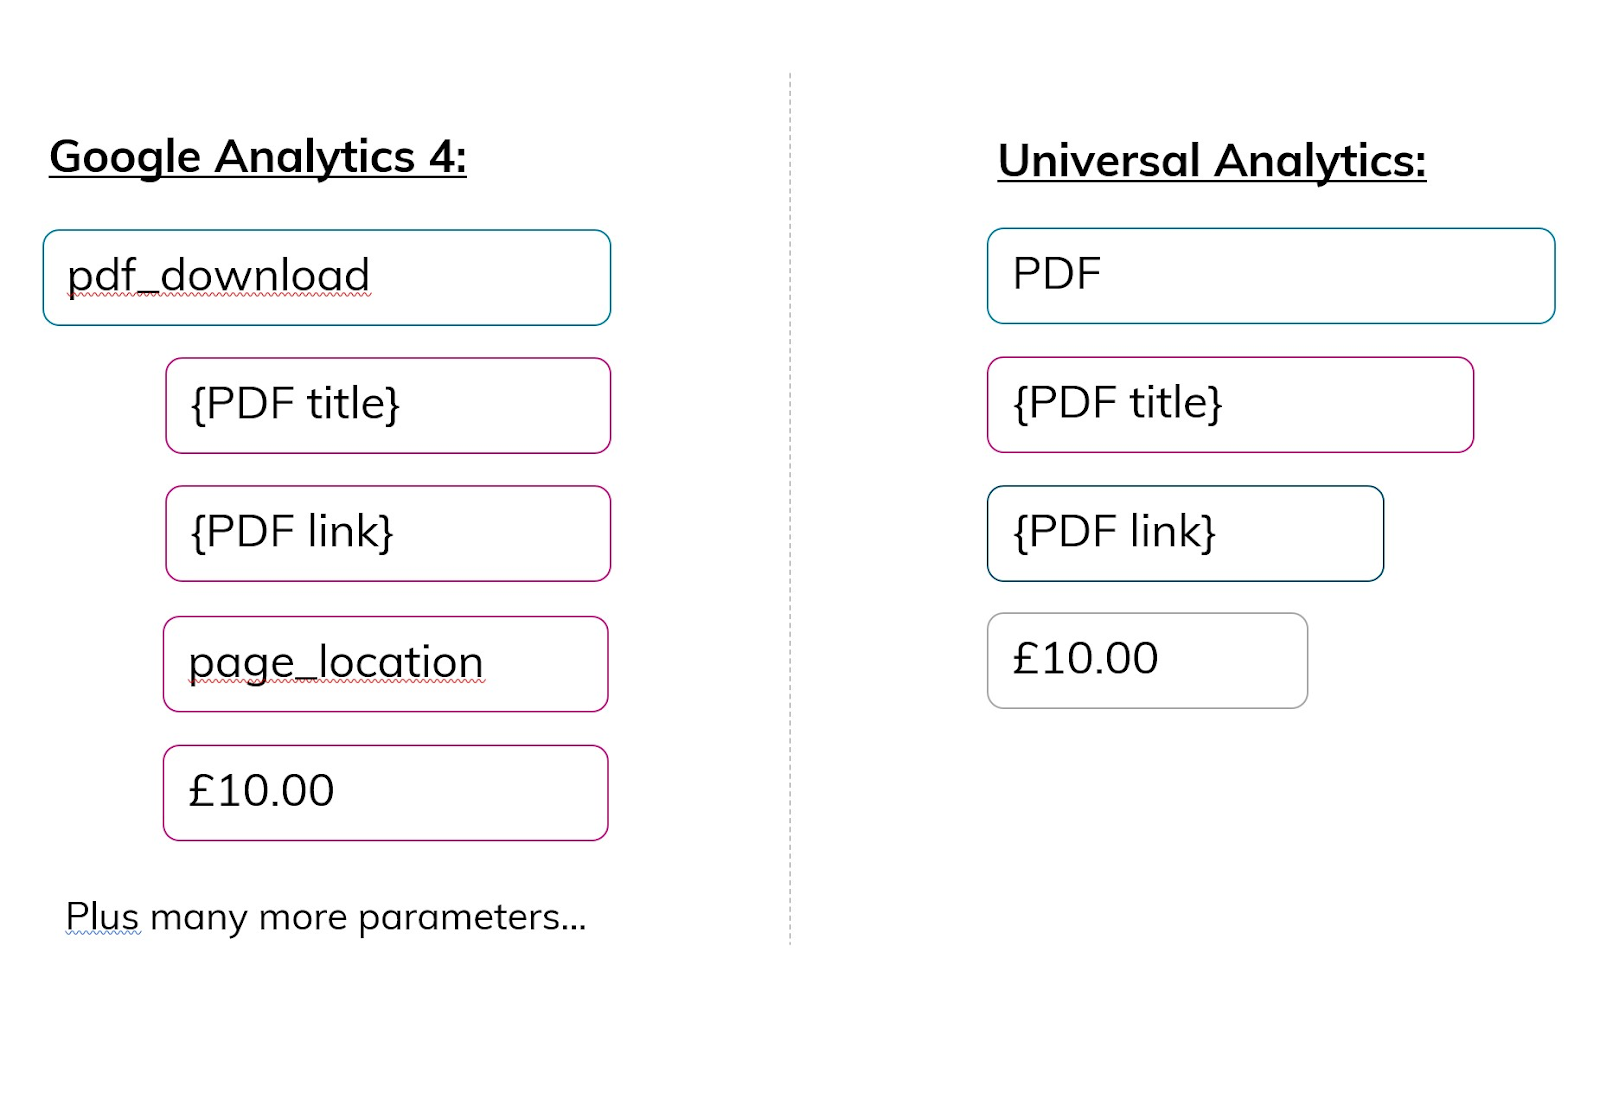
The benefit of this is that you can get more information associated with events, and the use of this data is more flexible to work with.
New features for the advanced user
- Templated reports for e-commerce funnels. This was a feature that previously only was available to Analytics 360.
- No limits on the volume of data you can send.
- Free connection to BigQuery, previously only available to Analytics 360.
Cross-domain tracking does not require code adjustments and can be done within GA. - Combines mobile app and website data in it’s reporting and analysis.
- In the UI you have a set of reports called “Analysis” which lets you do advanced analytics that were previously only available for Analytics 360 users.
- Debugging available within the UI.
Differences in the UI
GA4 is organized in a slightly different way than UA in the User Interface. There is no view as with UA (Account -> Property -> View), instead there are only (Account -> Property).
Utilizing the Analysis hub to make custom reports in GA4 can be really powerful, now that GA4 has machine learning at the core to produce valuable insights tailored to your business. This makes Google Analytics more suited for analysis and investigation, rather than just reporting on KPIs.
The downside to this is that if you have been using UA for a while, you might find the changes overwhelming and some of the reports you’re familiar with are missing. Also, since there are less and simplified reports, the reports give less value out-of-the-box, and require more tweaking which can be difficult to less advanced users. Also, for users that manage GA for multiple clients the reports in GA4 might be different to each client, and therefore require more onboarding on new projects.
Menu
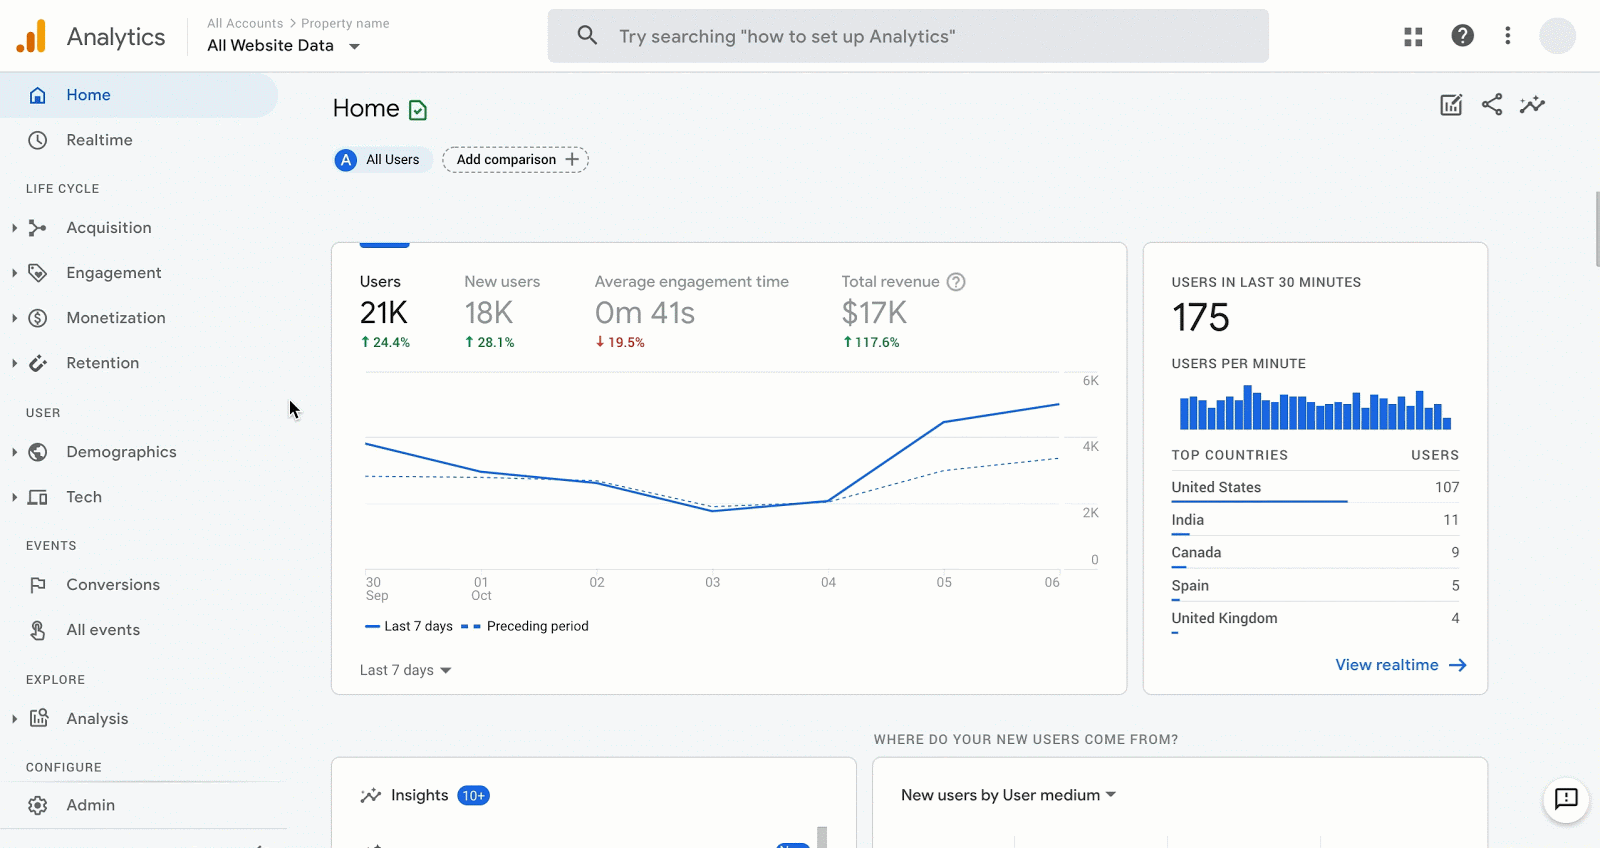
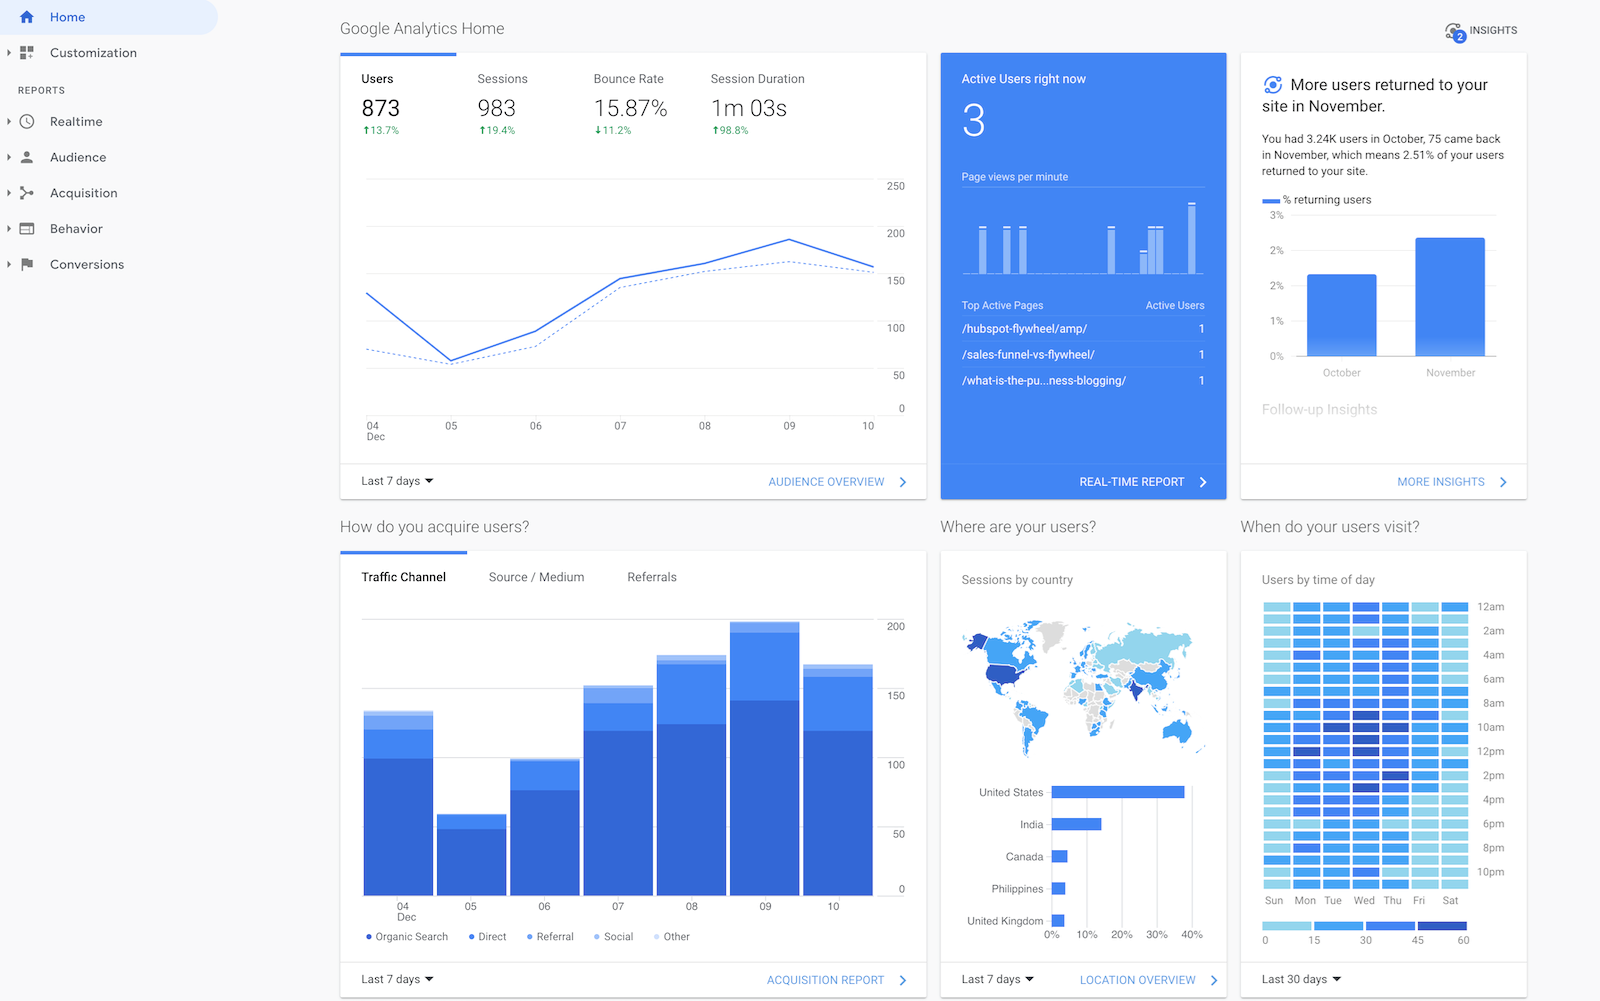
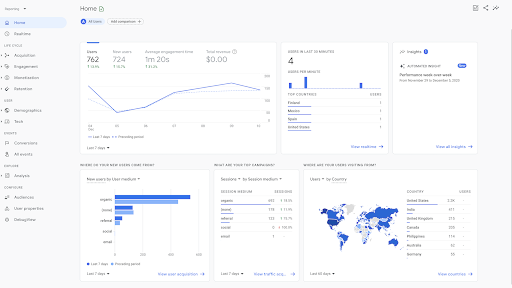
As you can see in the two screenshots below, the biggest change in the UI between UA and GA4 is the menu structure.
The home page is very similar to the one in UA, with a summary of traffic, real-time data, insights and how the site has been visited. The real-time report is similar to UA, but with more data about users that have been active within the last 30 minutes.
The other analytics-reports are now grouped into categories for life cycle, user and events. Let’s take a look at what lies beneath these categories.
Life cycle reports
Helps you analyze the data by the stage your customers are in during the purchase journey. In the life cycle category you will find reports on;
- Acquisition
Shows how users and traffic has been acquired to the website or app. This includes medium, sources and campaigns. - Engagement
Shows how users are engaging with your site. Such as page views, time spent on site, scrolls, triggered events etc. - Monetisation
This is the e-commerce report for GA4, with metrics such as revenue, buyers, items bought etc. - Retention
Here you can see the user lifetime value and how new and returning users engage with your site.
User reports
Gives insights on user demographic and technologies used on the website. In the user category you will find reports on;
- Demographics
Here you can see their location, gender, interests and language - Tech
Reports on what kind of technology your users use, such as OS, device, browser, screen resolution etc.
Events reports
Provide data on event tracking and conversion actions on your site or app. This is also where you can create custom events and conversions in GA.
- Conversions
This report shows the event that you have specified to qualify as conversions. - All events
This report shows all events you have set up such as click, scroll, file downloads, phone calls, email clicks etc.
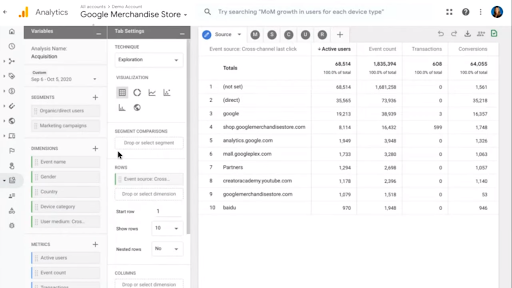
Explore
This category is where you find the analysis hub and report template gallery to make custom reports.
Analysis hub was a feature that previously only was available for Analytics 360, but is now free in GA4. Analysis hub gives you the option to do advanced analytics by creating custom reports that go beyond the standard reports. Much like how you create reports in Google data Studio, you can create reports directly in GA4’s Analysis Hub that suit your business requirements. In the template gallery you find report templates for e-commerce, funnel analysis, path analysis, cohort analysis, user behaviour and much more.
Configure
This is the configure section that gives you access to manage users and access the debug view.
- Audiences
Create audiences and segment users to analyze data. For example track and address users who have made a purchase vs. who have not. - User properties
Here you can specify your users’ different attributes, which can be used as building blocks for the audiences. For example you can specify the users favourite brand, profession etc. For each audience you can create up to 25 unique user properties. - Debug view
In UA, if you wanted to debug tracking for enhanced e-commerce, you had to wait hours for the data to land in the reports. Now with Debug View you can test these events in real time when “debugging” is activated. This can be activated in 3 ways which will automatically send event hits to the debug viewer.
1. Have the debugger Chrome extension active, events you make will appear in Debug View
2. GTM preview mode automatically makes data visible in Debug View
3. Debug_mode event parameter attached to events
The GA4-property provides a cross-device view of the whole customer lifecycle and gives marketers valuable insights and predictions. It will be interesting to see the future of Google Analytics and the combination of predictive analytics and AI.
Contact us to learn more about GA4, how to get started with tracking and how it can benefit your digital marketing strategy.
Kontakt oss her